This analysis will examine six years of data that was aggregated by SANDAG and processed by the San Diego Regional Data Library to visualize crime patterns on a weekly and hourly basis. The analysis uses 797,978 crime incidents. The data is published in CSV and shapefile form at the Library’s data repository
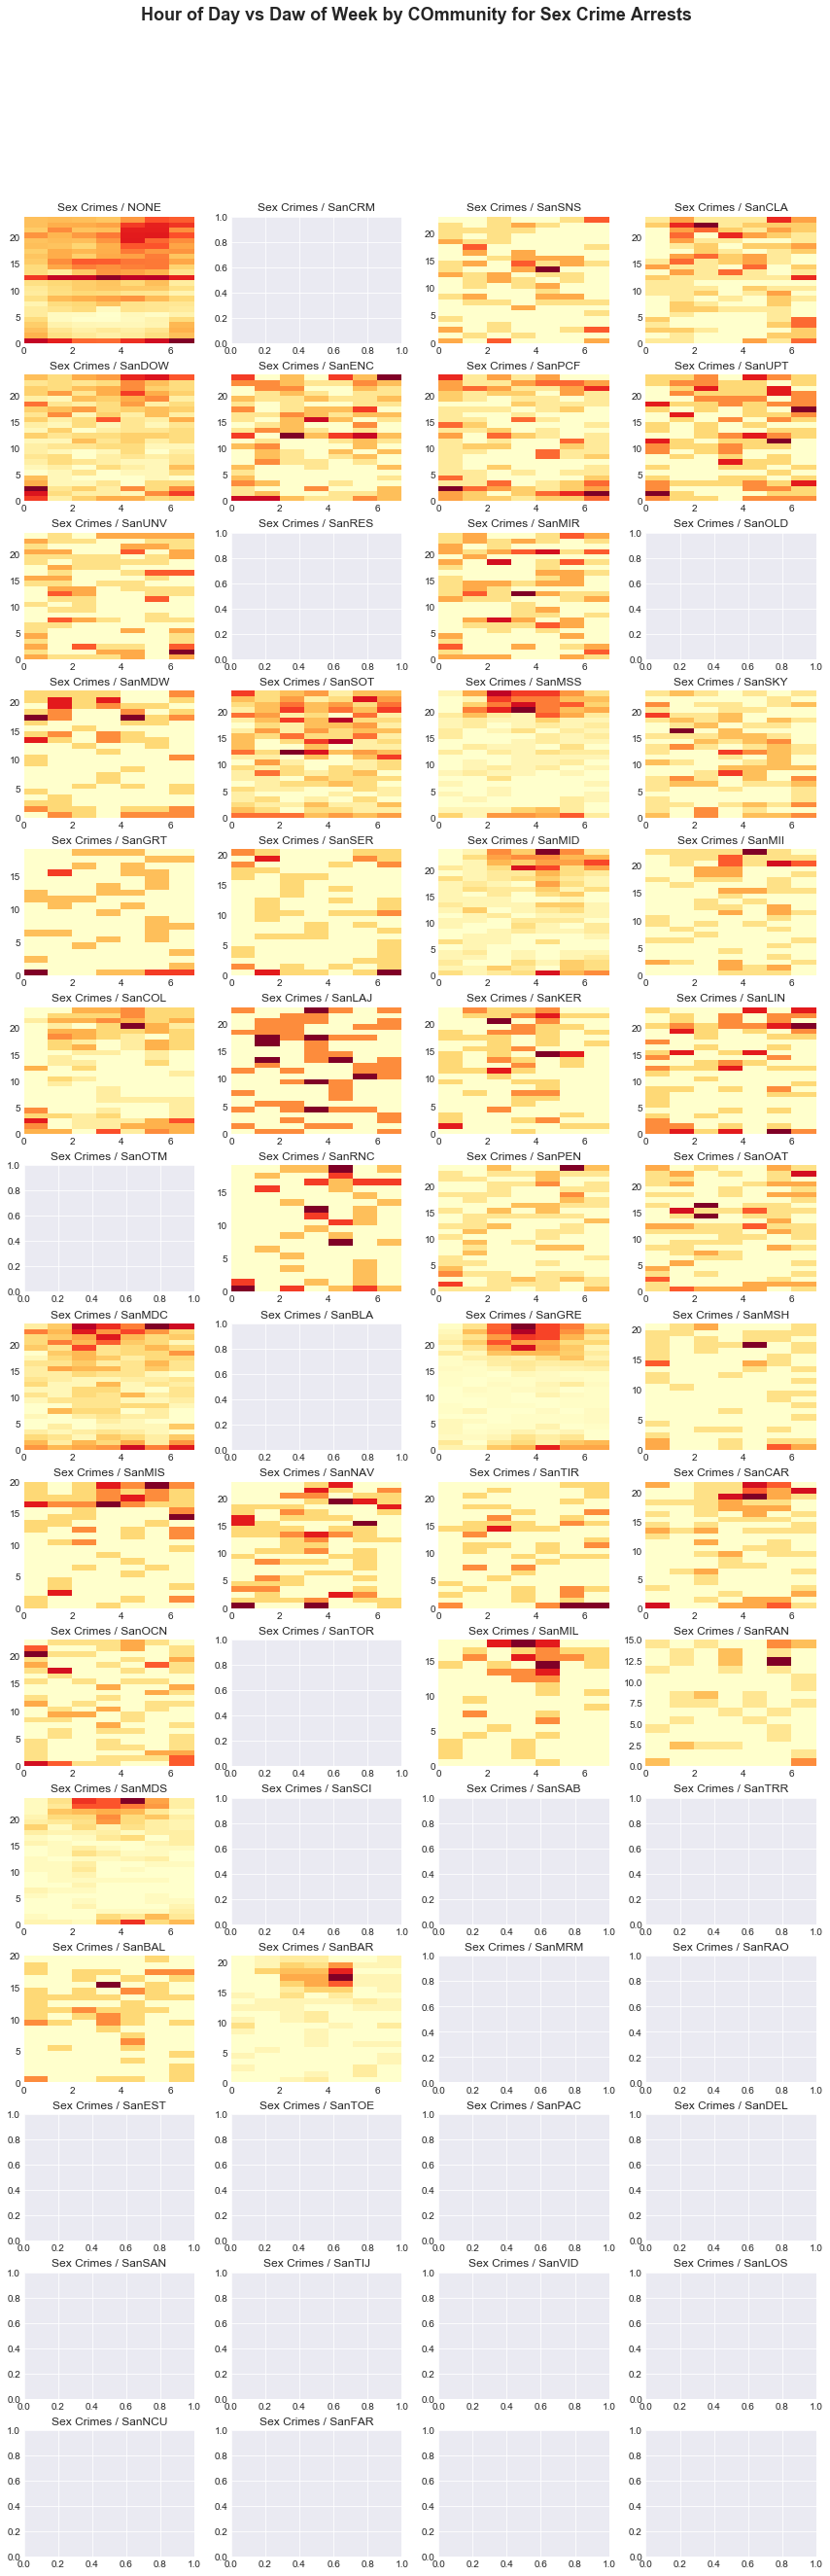
These heat maps, also know as rhythm maps, are square grids where each hour of the week is represented by a cell. The vertical axis is hour of day, and the horizontal axis is day of week, with Sunday being the area between 0 and 1, etc. The color indicates the number of crimes in that hour of the week, with red being larger than yellow. Note that each grid is scaled independently, so a red square in one heatmap is not comparable to a red square in another heatmap. This visualization is only for looking at the paterns of crimes over time; it doesn’t tell you anything about the number of crimes, except the relative relationship between hours in a single grid.
There are three types of incidents: * Crime Cases * Arrests * Citations
However, this version of the dataset doesn’t have the column from the original dataset that has these values, so this analysis will include all of them.
There are 12 crime categories, expressed as the codes established by the FBI. ( UCR codes. )
First we will look at all of the incidents in the city, and then by each type. A grid is blank when there are fewer than 40 incidents of that type and category.
| 0 | 1 | 2 | 3 | 4 | |
|---|---|---|---|---|---|
| id | 0 | 1 | 2 | 3 | 4 |
| date | 2008-01-01 00:00:00 | 2008-01-01 00:00:00 | 2008-01-01 00:00:00 | 2008-01-01 00:00:00 | 2008-01-01 00:00:00 |
| year | 2008 | 2008 | 2008 | 2008 | 2008 |
| month | 1 | 1 | 1 | 1 | 1 |
| day | 2922 | 2922 | 2922 | 2922 | 2922 |
| week | 0 | 0 | 0 | 0 | 0 |
| dow | 2 | 2 | 2 | 2 | 2 |
| time | 2017-11-12 00:00:00 | 2017-11-12 00:00:00 | 2017-11-12 00:00:00 | 2017-11-12 00:00:00 | 2017-11-12 00:00:00 |
| hour | 0 | 0 | 0 | 0 | 0 |
| is_night | 1 | 1 | 1 | 1 | 1 |
| type | THEFT/LARCENY | FRAUD | FRAUD | FRAUD | FRAUD |
| address | 2500 Block Orion Way | 1200 Block Aguirre Drive | 2400 Block Golfcrest Loop | 2500 Block Catamaran Way | 400 Block J Street |
| city | SndCAR | SndCHU | SndOCN | SndCHU | SndCHU |
| segment_id | 103154 | 154361 | 71714 | 172915 | 38410 |
| nbrhood | NONE | NONE | NONE | NONE | NONE |
| community | NONE | NONE | NONE | NONE | NONE |
| comm_pop | 0 | 0 | 0 | 0 | 0 |
| council | NONE | NONE | NONE | NONE | NONE |
| council_pop | 0 | 0 | 0 | 0 | 0 |
| asr_zone | NaN | NaN | NaN | NaN | NaN |
| lampdist | NaN | NaN | NaN | NaN | NaN |
| lat | 33.1378 | 32.6303 | 33.1934 | 32.656 | 32.6261 |
| lon | -117.266 | -117.004 | -117.316 | -116.958 | -117.079 |
| desc | PETTY THEFT | FRAUD | FRAUD | FRAUD | FRAUD |
| gctype | cns/segment | cns/segment | cns/segment | cns/segment | cns/segment |
| gcquality | 65 | 65 | 22 | 65 | 65 |
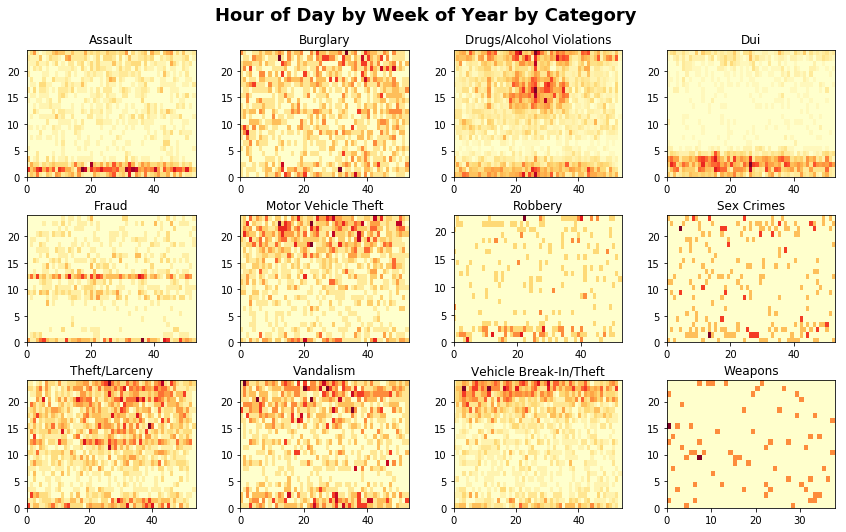
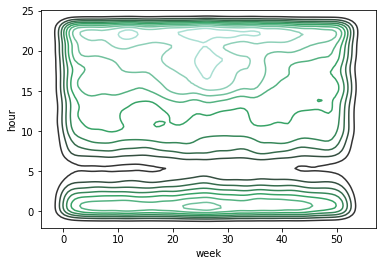
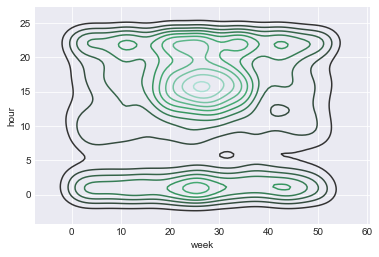
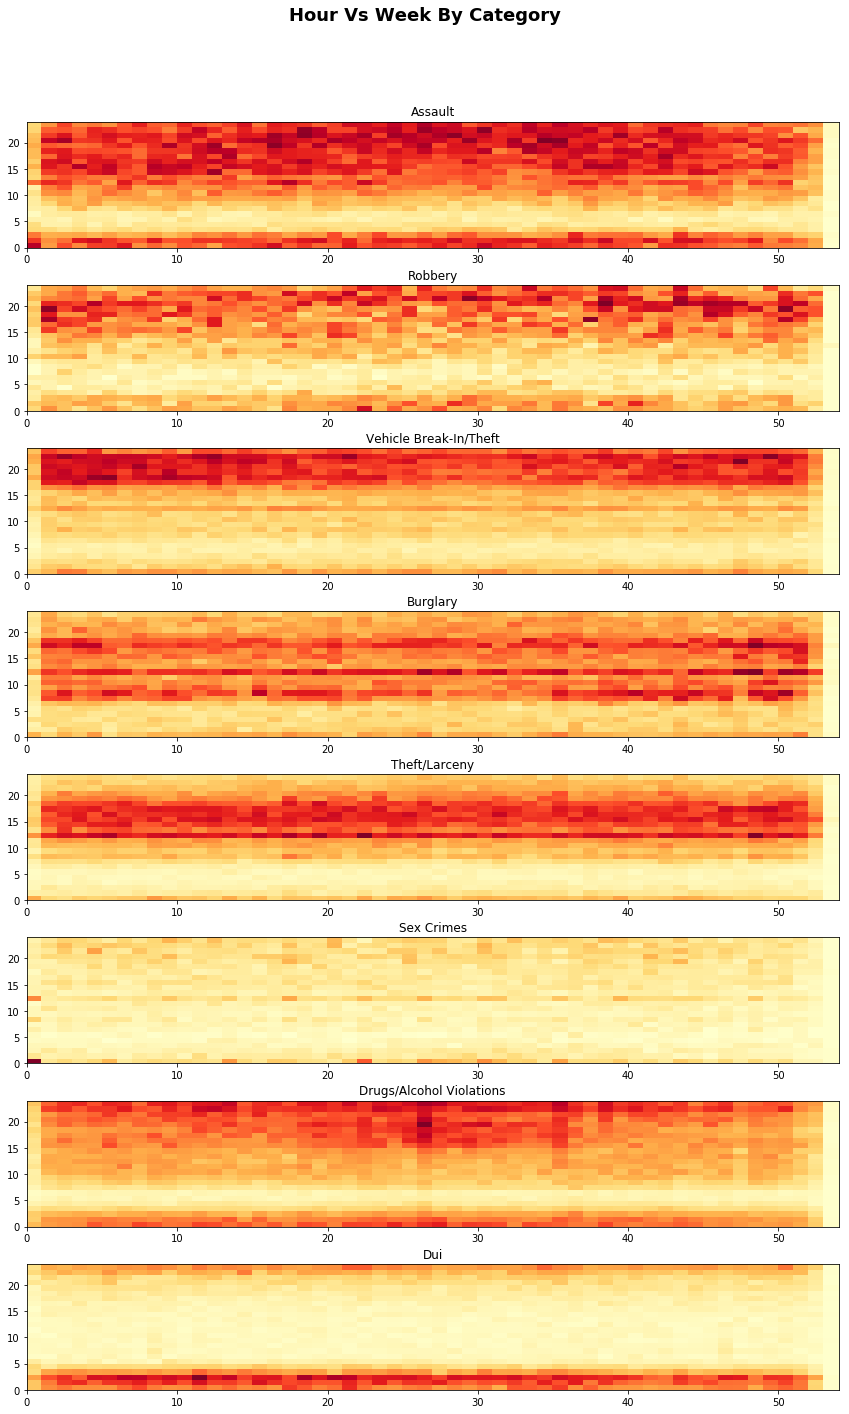
Hour vs Week of Year By Major Crime Type
These maps show the hour of the day on the vertical axis and week of year on the horizonal, with all of the years in the dataset combined. The maps clearly show a 5AM daily lull, and a spike in DUIs in the middle of the summer.
Week of Year by Data Year
With a vertical axis of the year of the data, these maps plot one box per week for all weeks in the dataset. THe most significant patter is the reduction in DUI and Alcohol crimes in the later years.
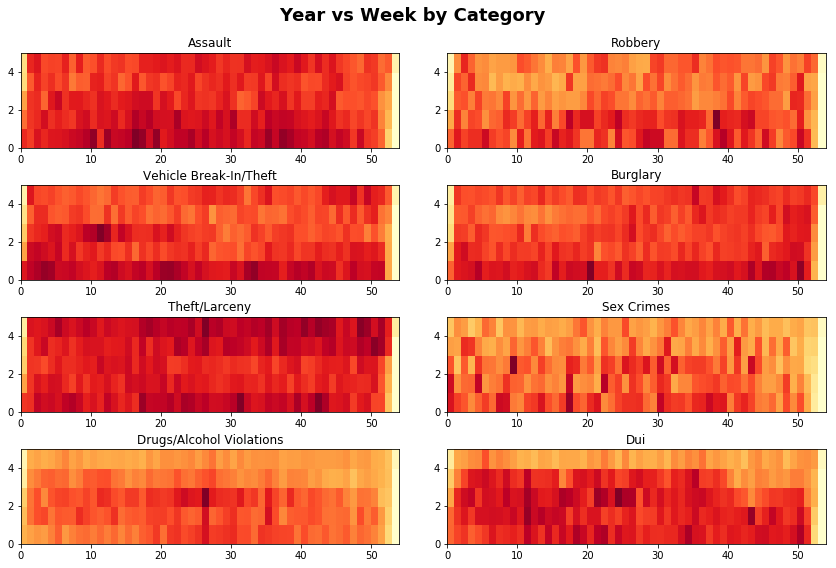
In ‘Year vs Week by Category’, the years run from 2006 to 2013, where ‘7’ is 2013.
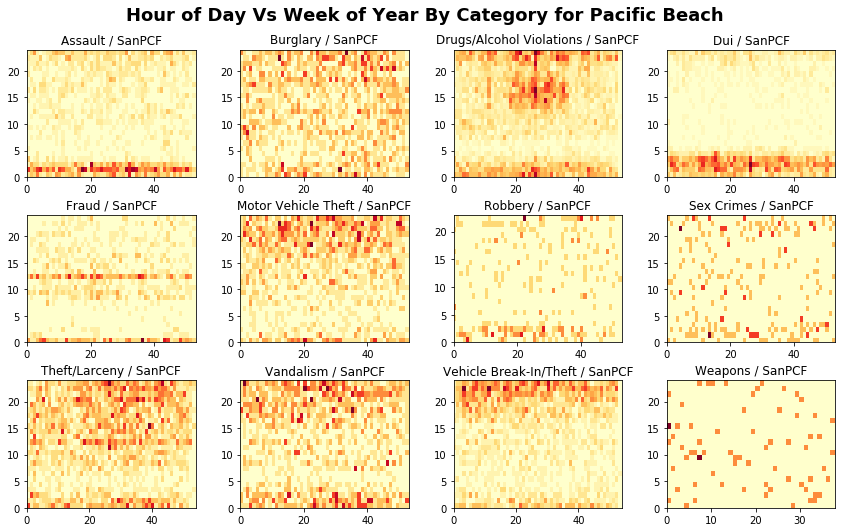
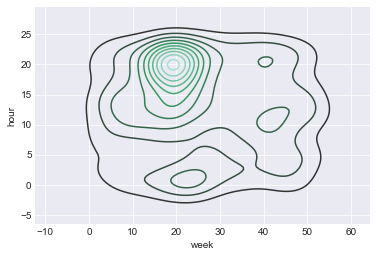
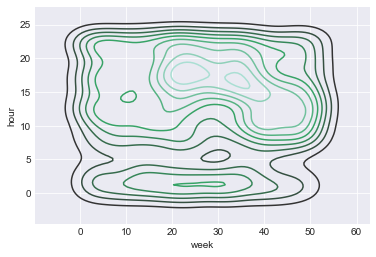
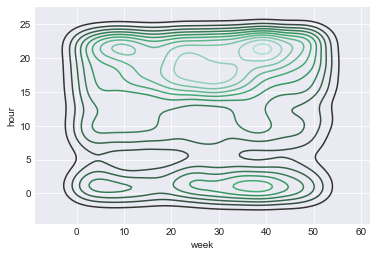
Hour of Day Vs Week of Year, for Pacific Beach
These maps show a seasonal rhythm, with the strongest being the cluster of alcohol crimes in the afternoon and evenings in the summer.